Budget Matters Blog
Category: Transparency & Data
Announcing our new partnership with the Institute for Policy Studies: A Letter to NPP Supporters from Executive Director Nora Ranney
By
Lindsay Koshgarian
Posted:
|
Transparency & Data
As of October 1, National Priorities Project (NPP) will join the Institute for Policy Studies (IPS).
A Trump Budget?
By
Lindsay Koshgarian
Posted:
|
Budget Process,
Transparency & Data

Budgets are moral documents, and the new president’s budget will reveal so much.
Open Community Forum this Friday
By
Nora Ranney
Posted:
|
Budget Process,
Debt & Deficit,
Education,
Health Care,
Military & Security,
Social Insurance, Earned Benefits, & Safety Net,
Taxes & Revenue,
Transparency & Data

Please mark your calendars and join us for an engaging discussion on the challenges and opportunities that lay ahead.
Will Congress use the budget to pass these damaging campaign finance rules?
By
Guest Blogger
Posted:
|
Budget Process,
Transparency & Data

As if Citizens United weren’t enough, members of Congress are using the federal budget process to open the doors to more money in politics.
Few Days Remain for Congress to Pass a 2016 Budget
By
Jasmine Tucker
Posted:
|
Budget Process,
Transparency & Data

Lawmakers return to Capitol Hill today from an August recess with very little time left to pass a budget for fiscal yeat 2016.
Examining Federal Spending by Michigan State University
By
Guest Blogger
Posted:
|
Budget Process,
Transparency & Data

Most U.S. universities, like states and local governments, receive a good deal of federal grant money each year, especially for research and development purposes. Michigan State University recently pledged to do half of its $400 million per year purchasing budget with women- and minority-owned businesses.
How DATA Act implementation is opening up federal spending
By
Guest Blogger
Posted:
|
Transparency & Data

In May 2014, President Obama signed the Digital Accountability and Transparency Act (DATA Act) into law. Once implemented, the DATA Act will make it easier to understand how the federal government spends money.
Post-Election NPP: The 114th Congress and Beyond
By
Becky Sweger
Posted:
|
Transparency & Data

No matter who's in office, NPP will continue its pursuit of a transparent, accessible federal budget.
Will You Vote On Tuesday, November 4?
By
Lindsay Koshgarian
Posted:
|
Budget Process,
Debt & Deficit,
Education,
Health Care,
Military & Security,
Social Insurance, Earned Benefits, & Safety Net,
Taxes & Revenue,
Transparency & Data
Will You Vote On Tuesday, November 4?
Senate Races, Gubernatorial Races, and State Smart
By
Becky Sweger
Posted:
|
Transparency & Data
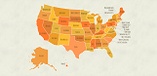
Election 2014 is almost upon us. "Interest, amuse, and amaze yourselves between campaign commercials" with State Smart.