Data Story: Tax Collections, Simplified
By
Becky Sweger
Posted:
|
Transparency & Data
Our latest data story is an example of how we sometimes "operate" on published data to make it more usable and accessible. When doing this, our guiding principles are: do not jeopardize the original data's integrity, document the methodology of our computations/aggregations, and provide the original, raw data via a link to the source or our API.
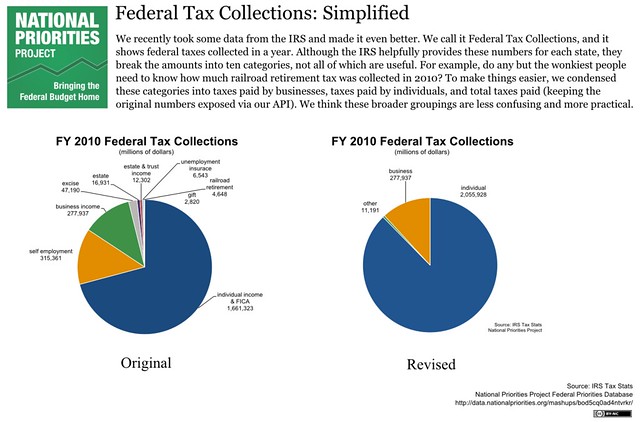
We recently took some data from the IRS and made it even better. We call it Federal Tax Collections, and it shows federal taxes collected in a year. Although the IRS helpfully provides these numbers for each state, they break the amounts into ten categories, not all of which are useful. For example, do any but the wonkiest people need to know how much railroad retirement tax was collected in 2010? To make things easier, we condensed these categories into taxes paid by businesses, taxes paid by individuals, and total taxes paid. We think these broader groupings are less confusing and more practical. Our recent publication, Federal Spending Keeps Iowa, New Hampshire Afloat, shows the individual taxes category in use.
View federal tax collections back to 1998, as well as notes and sources, here.
