Data Wednesday: Per Capita
By
Becky Sweger
Posted:
|
Transparency & Data
This is the latest entry in NPP’s weekly Data Wednesday series, a getting-started guide to NPP’s Federal Priorities Database. All previous posts are archived here.
Two weeks ago, Data Wednesday used percentages to introduce normalization. This week’s post takes a look at per capita, another type of normalization.
As an example, consider this map of FY 2010 Supplemental Nutrition Assistance Program (food stamp) spending.
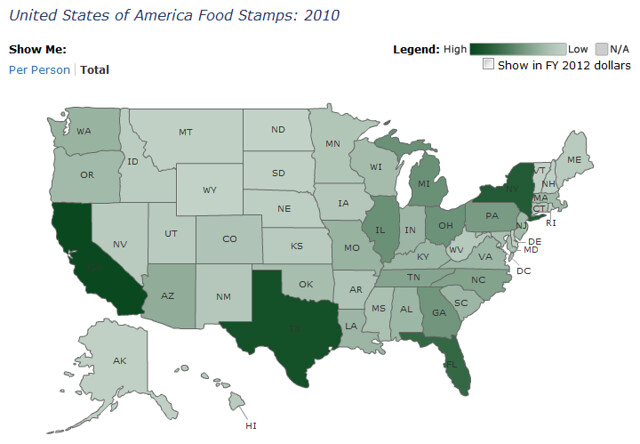
Using the map’s legend, you can quickly see that California and Texas got the most funding. Not surprising, since those states have the most people.
We can better compare food stamp spending across states by normalizing—in this case, dividing a region’s total dollar amount by its population to get a per capita or per person figure. By adjusting for population, we get a different picture of where the money is going. Here’s the food stamp map again, this time using per capita amounts:
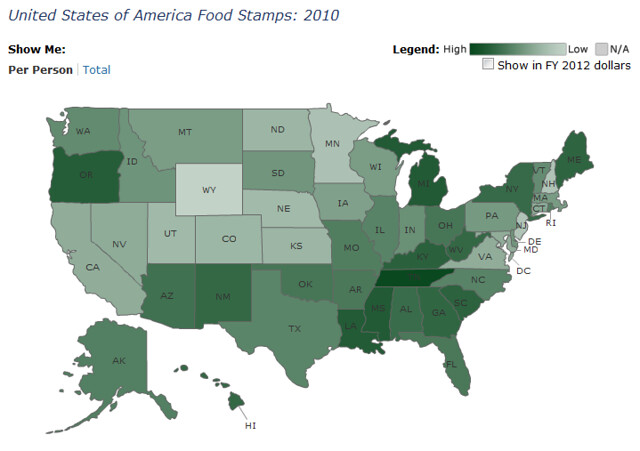
This time, Tennessee emerges as the state with the highest spending on food stamps. That’s because in per-capita terms, Tennessee receives more food stamp aid than California or Texas. And because the food stamps dataset contains county-level information, you can click on Tennessee to get a picture of per capita spending in its individual counties:
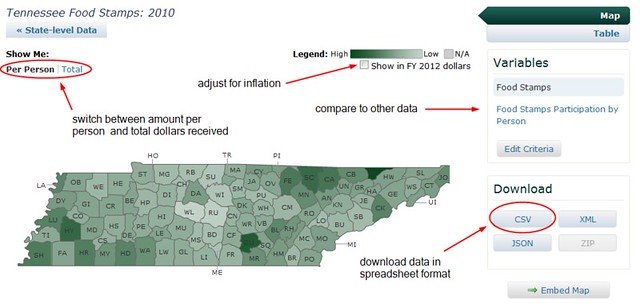
All expenditure data in the Federal Priorities Database are displayed as both total dollars and as per capita dollars—so you can always normalize the data as we just did for food stamp spending. As always, what you use will depend on the context.