Civic Hacking With Hack for Western Mass
By
Jason Leveille
Posted:
|
Budget Process,
Transparency & Data

Photo Courtesy of Molly McLeod
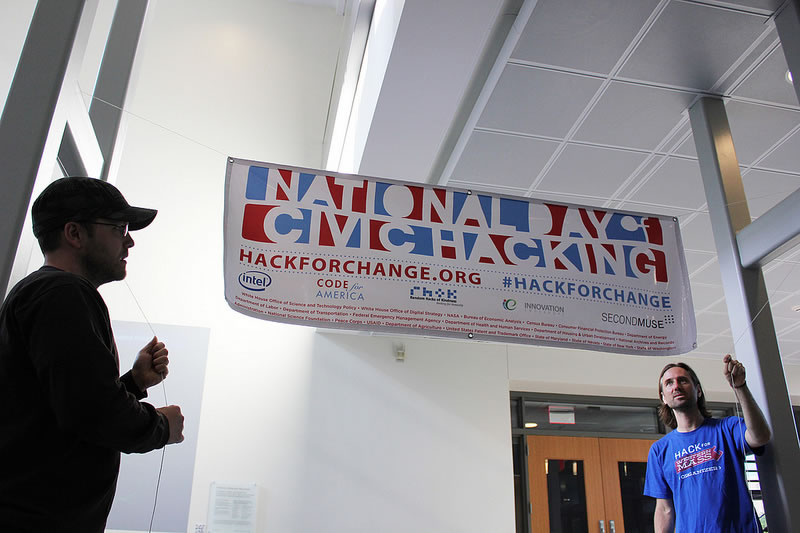
This past weekend ~100 hackers from all over Massachussetts (and Eliot, ME :) generously donated their time and expertise for the National Day of Civic Hacking event for Western Mass. This inspiring event was one of 95 held across the country.
The event will bring together citizens, software developers, and entrepreneurs from all over the nation to collaboratively create, build, and invent new solutions using publicly-released data, code and technology to solve challenges relevant to our neighborhoods, our cities, our states and our country.
@hackforchange About National Day of Civic Hacking
The Projects
There were some outstanding projects at the event. Turnout was great (~100 hackers), so each project seemed to be adequately "staffed". A strong indicator of success were the presentations on Sunday. The quality of the work produced was impressive. I’ve continued to see activity on GitHub since Sunday afternoon. It’s clear that the folks involved with each project care about its success, and that they’re willing to see it through to completion.
Visualizing Federal Data
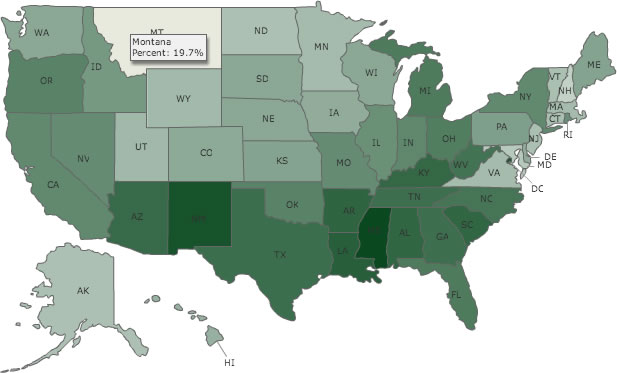
NPP has a great tool for mapping federal data. Unfortunately, the map for the data is generated in Flash.

Flash Map: Percentage of youth under age 18 estimated to be living in poverty during 2011. Darker colors indicate higher percentages.
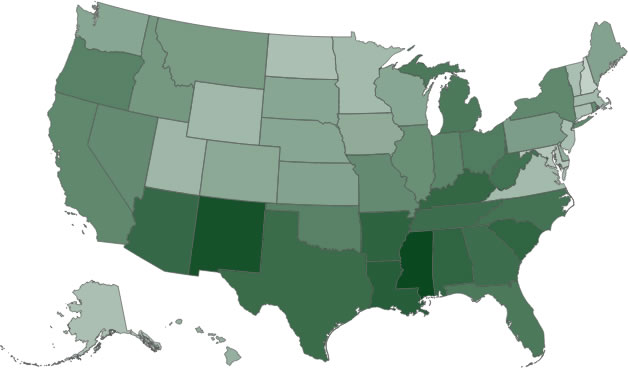
Part of our goal for 2013 is to make the main NPP site more accessible and responsive to varying devices. I’ve been tackling bits and pieces of that goal over the past few months, and figured this event would be a great time to start getting away from flash. With the help of Chris Duncan I made some good progress toward that goal.

D3/JavaScript Map: Percentage of youth under age 18 estimated to be living in poverty during 2011. Darker colors indicate higher percentages.
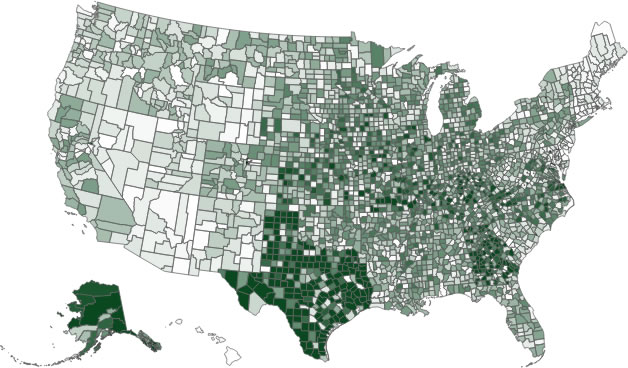
We allow folks to drill into a state to view data at the County level. However, we feel that painting a picture of budget data showing all counties in the US at once may tell a more compelling story. I have much more work to do here, however I did make some progress on that front.

D3/JavaScript County Map: Colors on this map mean nothing. They merely helped with the proof of concept.
In general, I’m happy with what Chris and I were able to accomplish in a few days. I had never worked with D3 before, which was a fun experience. I have a lot of work left to do, however this past weekend was a big push in the right direction. Soon the NPP/Data site will be free of flash maps.
An Awesome Event
The event organizers deserve a big pat on the back. The food was great (SUSHI!!!) and there were plenty of healthy choices for sustained energy. The location couldn’t have been more comfortable, and the energy throughout the weekend was really … energizing. This was the first time I’d attended a civic hacking event (I attended a Facebook event a few years ago) and I’d definitely attend again. I’ll be eagerly anticipating this event next year.