President Obama Proposes 2016 Budget
Feb. 4, 2015 - Download PDF Version
New proposal includes spending above sequestration caps for defense and non-defense, and many initiatives that would be widely popular with Americans.
By: Jasmine Tucker and Lindsay Koshgarian
Today President Obama released his seventh budget proposal, requesting $4 trillion in fiscal year 2016. His proposal calls for $74 billion in additional discretionary spending above the sequestration caps set in place for the upcoming year. The additional spending would be about evenly split between defense and non-defense discretionary programs.
This budget request is President Obama’s first on-time budget proposal since 2011. Here are highlights of what the new budget proposal contains:
Total Spending and the Budget Control Act
In his budget proposal for 2016, President Obama proposed $4 trillion in total spending,[1] including more than $1.15 trillion in discretionary spending, an increase of about 2 percent relative to 2015 enacted levels. President Obama proposes spending levels for 2016 that exceed sequestration’s spending caps by $74 billion. Spending increases are about equally split between defense and non-defense program. Defense programs – including the Department of Defense, nuclear weapons, and related activities would receive $38 billion over fiscal 2016’s sequestration cap on defense programs while non-defense programs would receive an additional $37 billion above the sequestration cap. [2]
The president proposes $60 billion over 10 years for a new initiative that would allow students to attend community college for up to two years tuition free and would again provide expanded Head Start and universal pre-kindergarten.
The budget also includes $478 billion in additional infrastructure spending over the next six years, which would pay for surface transportation improvements such as roads and bridges. The president proposes to pay for this through various tax reforms.
Sixty-two percent of Americans would favor raising taxes on the wealthy and corporations to fund national priorities such as education and job training. [3]
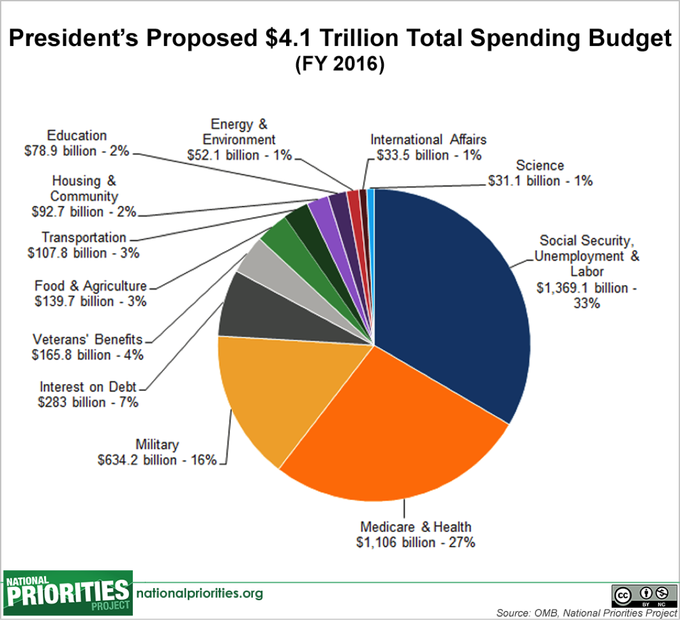
Notably, the plan includes $585 billion in discretionary funding for the Department of Defense, including a base budget of $534 billion, and war funding of $51 billion. This does not include separate programs through the Department of Energy for nuclear weapons, or other military spending. This would represent a significant increase over the analogous enacted 2015 spending level of $554 billion.
Taxes and Revenue
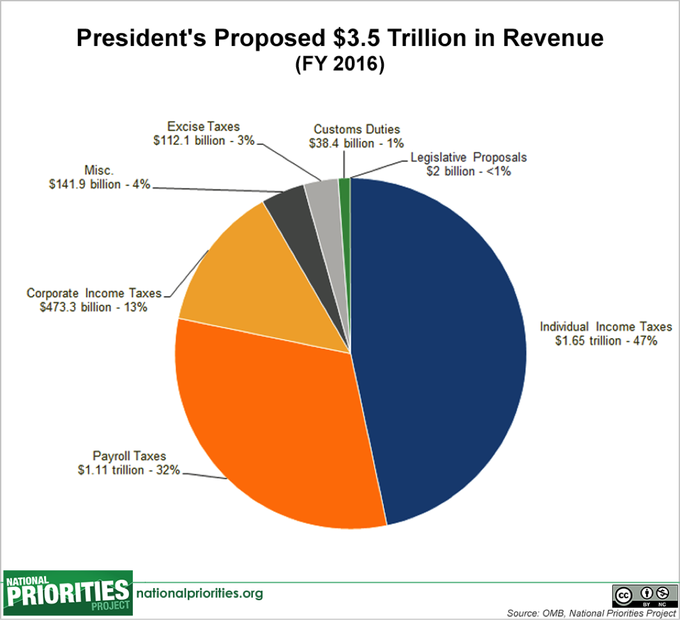
The president’s proposal would raise $3.5 trillion in tax revenue in fiscal year 2016, an increase of more than nine percent relative to 2015. It includes mechanisms for raising new tax revenues, through changes to taxes on capital gains and corporate profits, as well as new corporate fees. It also includes new proposed tax breaks.
Six in 10 Americans believe wealthy individuals don’t pay their fair share in taxes.[4]
The budget proposal would bring in new revenues by changing how capital gains (income earned from investments in stocks, real estate, etc.) are taxed. Specifically, the president would raise the top capital gains tax rate from 23.8 percent to 28 percent – the top rate under President Reagan – and would close the “trust fund loophole” under which capital gains that are inherited from a previous generation are never taxed. This would raise an estimated $208 billion over 10 years.
The budget would impose a new fee on financial institutions that engage in “excessive borrowing.” The new fee would raise $112 billion over 10 years. The president would also reform the business tax system and close loopholes in order to shore up the nation’s Highway Trust Fund, expected to run out of funding in May 2015, for another six years.
The president’s budget includes a series of new or expanded tax breaks targeted at working and middle class Americans. It would expand the Earned Income Tax Credit (EITC) to low-income childless workers and provides the credit to more workers based on income and age. It triples the current maximum child care tax credit to $3,000 per child. It would also create a new second-earner tax credit that would provide $500 to families where both spouses work, and it expands eligibility for the American Opportunity Tax Credit, a credit that helps students pay for college expenses. These middle-class tax breaks would be paid for by proposed changes to the capital gains tax and new financial services fee.
Education
The budget provides $70.7 billion in discretionary education funding in fiscal year 2016, an increase of five percent over the 2015 enacted level. The proposal includes a new federal-state initiative that would allow students to attend community college tuition-free for up to two years at a cost of $60 billion to the federal government over 10 years.
The president also requests $1 billion in new funding for Title I, the federal program that provides aid to schools serving disadvantaged students, as well as $4 billion for teacher training and recruitment programs.
The budget proposal also calls for $66 billion for the president’s signature Preschool for All initiative. It would also provide $15 billion over 10 years to continue and expand the existing home visiting program for young children. These and other initiatives would be paid for by raising an additional $95 billion over 10 years by increasing the tobacco tax. The president also requests an additional $1.5 billion investment in the Head Start program over the 2015 spending level, among other investments.
Sixty-seven percent of Americans say that improving the education system should be a top priority for the president and Congress in 2016.[5]
Military and War
The president’s budget proposal would spend $612 billion on national defense discretionary programs, including funding for the Pentagon, war, nuclear weapons, and other related expenses, a level higher than any under President Reagan. This represents a 4.5 percent increase over the 2015 enacted level and exceeds spending caps set by the Budget Control Act by $38 billion.
The proposal includes $534 billion for the Department of Defense base budget, a figure that does not include war costs or nuclear weapons activities within the Department of Energy. That represents a more than $38 billion increase – a more than 7 percent increase – relative to 2015 enacted spending levels and would be the highest Department of Defense base budget in history. The budget funds the development of 19 more F-35 fighter jets than were produced in 2015, despite the fact that the planes are billions over budget and years behind schedule.
The president also calls for nearly $51 billion in a separate account called the Overseas Contingency Operations (OCO) for war activities, which would add to the more than $1.6 trillion the U.S. has already spent on war since 2001. The OCO budget includes $5.3 billion for continued operations against the Islamic State of Iraq and Syria (ISIS). Since OCO is not subject to funding caps or sequestration cuts, billions of dollars in the war budget have been widely referred to as a “slush fund.”
Climate Change
The president’s budget request includes measures to address climate change, such as an investment of $7.4 billion in clean energy technology programs, an area that received reduced funding under the fiscal year 2015 budget. It would also provide $1.29 billion for the Global Climate Change Initiative, which would reduce emissions from deforestation, expand clean and efficient energy use, and phase down chemicals with high global warming potential. It would also provide $4 billion over 10 years for a Clean Power State Incentive Fund to provide funding to states that achieve faster or greater than planned reductions in carbon emissions.
Seventy-four percent of Americans believe the federal government should be doing a substantial amount to combat climate change.[6]
The proposal also requests smaller investments in climate resilience and preparedness programs, including funding for new mapping efforts for flood zones, drought and wildfire resilience, and more.
Social Security
The president’s proposal would support a transfer of funds from Social Security’s retirement program to its disability insurance program to ensure the continued viability of the disability benefits program until further changes can be made in Congress. This contradicts a rule proposed by House lawmakers in January that would prevent such transfers. Reallocating funds from one trust fund to another, which Congress has done 11 times in the past, has historically been a non-controversial measure that prevents cuts to Social Security benefits.
Two in three Americans believe making the Social Security system sound should be a top priority for the president and Congress in 2016.[7]
The budget would also close loopholes that allow some high-income individuals to avoid Medicare and Social Security payroll taxes, which could provide the program with as much as $10 billion more per year by the end of the decade.
Health Care
The president’s budget proposes changes to Medicare, Medicaid, and other programs run by the Department of Health and Human Services that would result in $400 billion in savings over 10 years. For example, the proposal would ask Medicare beneficiaries to pay more for their health care coverage and would introduce a co-payment for Medicare beneficiaries who receive home health care services.
Budget Deficit
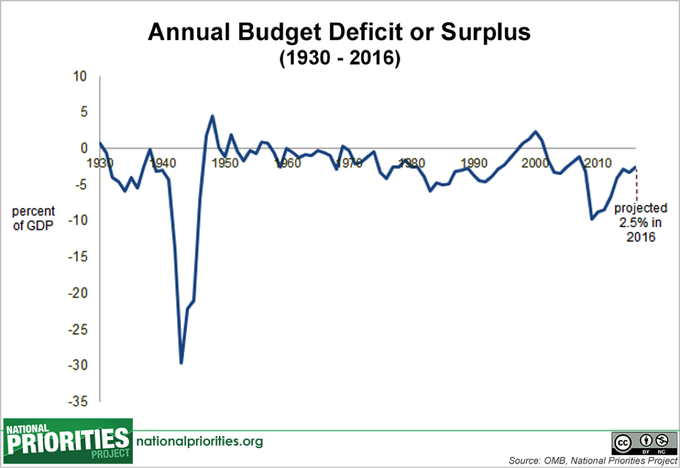
The president’s budget proposal would run a deficit of $474 billion in fiscal year 2016, down from $583 in 2015. It would also raise $638 billion in new revenues specifically for deficit reduction in 2016 and plans to achieve $1.8 trillion in total deficit reduction over 10 years from closing tax loopholes, changes to the Medicare Trust Fund and the Affordable Care Act (also known as Obamacare), and positive economic consequences of immigration reform.
As a share of the U.S. economy, the deficit is expected to be 2.5 percent in 2016, down from a high of 10 percent in 2009 following the Great Recession. Budget deficits are common; in the last half century, the U.S. ran a budget deficit in 44 out of 50 years. Budget deficits have averaged 3.1 percent of the U.S. economy since 1930.
What Is the President’s Budget Request?
Federal law requires that the president submit a budget proposal to Congress every February, which serves as a starting point for negotiations in Congress. The proposal begins the annual federal budget process that creates the budget for the coming fiscal year, which begins on Oct. 1. For more on who decides the federal budget, see Federal Budget 101.
Why Does the President’s Budget Matter?
Though the budget ultimately enacted by Congress may look very different from the budget request released by the president, the president’s budget is important. It’s the president’s vision for the country in fiscal year 2016 and beyond, and it reflects input and spending requests from every federal agency. At a time of conflict over federal spending, the president’s budget is largely a political document – but an important one, because it shows the president’s priorities in detail. It also serves as a benchmark against which all subsequent spending legislation will be measured.
For additional analysis of the President’s fiscal 2016 budget, see NPP’s President's 2016 Budget in Pictures.
Footnotes
- Spending on Government (administration) is less than zero and omitted in the total spending pie chart. Lower than zero spending can occur when segments of government have surpluses from previous years that they return to the federal government.
- The Budget Control Act of 2011 set in place discretionary spending caps that would take effect if lawmakers did not meet deficit reduction goals set forth in the law, which they did not.
- AFL-CIO/Hart Research poll, conducted November 4, 2014.
- Gallup poll, conducted April 3-6, 2014.
- Pew Research poll, conducted Jan 7-11, 2015.
- New York Times/Stanford University/Resources for the Future poll, conducted January 7-22, 2015.
- Pew Research poll, conducted Jan 7-11, 2015.