Data Wednesday: Time Traveling on the Map
By
Becky Sweger
Posted:
|
Transparency & Data
This is the third installment of our weekly posts about NPP’s Federal Priorities Database. If you missed installments one and two, we've archived everything here.
Last week, we took a look at the map that displays database search results. This week, I want to point out an important feature that works with the map: the year slider:
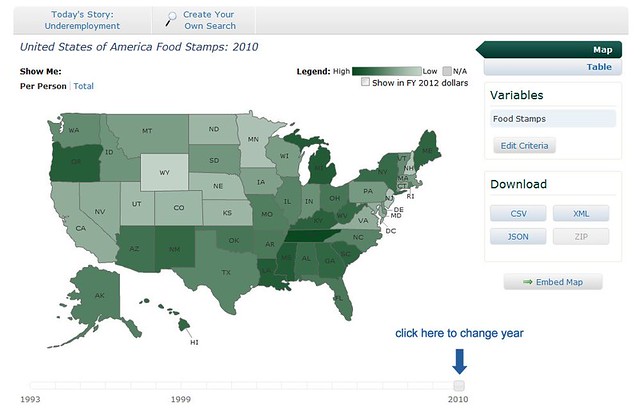
The Federal Priorities Database keeps historical information so you can track trends. The map, however, can only show one year of data at a time, and that’s where the slider—the horizontal bar immediately underneath the map—comes in:
After you run a search, the map will automatically display data for the most recent available year. To see a different year, find the square, grey box on the slider and drag it to the left with your mouse:
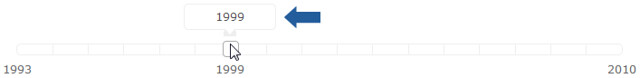
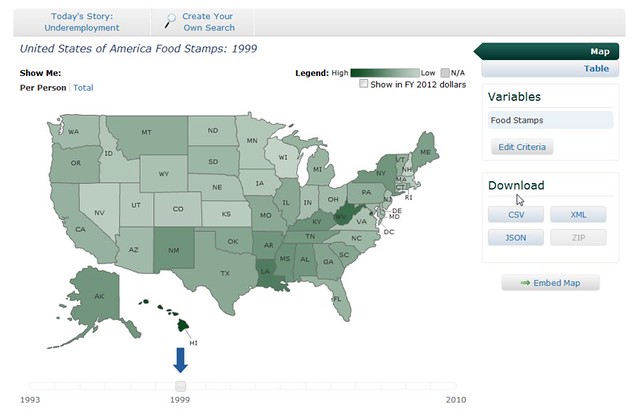
When you release the mouse, the data on the map will adjust to reflect the selected year. Here’s a view of per-person food stamp spending in 1999—very different from the 2010 version above.
And that's it! Next week, we’ll continue the time travel theme by discussing how to adjust dollar amounts for inflation.