Budget Matters Blog
Military Action Against ISIS? #NotSoFast #AmericaMustKnow #WhenWillitEnd?
By
Doug Hall
Posted:
|
Military & Security

In the wake of President Obama’s speech to the nation last Wednesday, and with a bill in Congress today authorizing further military action against ISIS, we are left with several troubling questions. At the top of the list are such critical, unanswered, questions as: Is military action, and the use...
State Smart: Cost of Military Contracts, Your State, and the Election
By
Becky Sweger
Posted:
|
Military & Security,
Transparency & Data

As the first in a series of releases leading up to State Smart, NPP profiles federal contract spending in the states, with a spotlight on the Department of Defense.
Spotlight: NPP's Military and War Spending Voter Guides
By
Lindsay Koshgarian
Posted:
|
Military & Security

With a war budget that has topped $1.5 trillion since 2001 and ongoing cuts to domestic programs, military spending raises serious questiosn for voters in the upcoming November 4 election.
Election 2014: A Voter's Guide to the Federal Budget
By
Lindsay Koshgarian
Posted:
|
Budget Process,
Debt & Deficit,
Education,
Health Care,
Military & Security,
Social Insurance, Earned Benefits, & Safety Net,
Taxes & Revenue,
Transparency & Data

It’s election season, when the political ads and campaign claims will fly. National Priorities Project’s 2014 Voter’s Guides will help you pierce through campaign rhetoric and get to the bottom of how candidates approach critical federal budget issues.
Fast Facts about our Workforce this Labor Day
By
Jasmine Tucker
Posted:
|
Social Insurance, Earned Benefits, & Safety Net

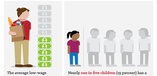
As you’re gathering your friends and family around for one last summer barbecue this Labor Day weekend, don’t forget to recognize the day as a time to celebrate workers for their contributions to the strength, well-being, and prosperity of our nation. In honor of Labor Day, here are some fast facts on the American workforce, minimum wage workers, and the unemployed.
Raising the Federal Minimum Wage is Good for Working Families, the Economy, and the Federal Budget
By
Doug Hall
Posted:
|
Social Insurance, Earned Benefits, & Safety Net
The federal minimum wage is normally seen as a labor standard that imposes costs on businesses, and, by lifting up the wage floor, benefits low wage workers. This is an accurate, but incomplete view, however, as it doesn’t show the impact on the federal budget that results from businesses failing...
Summer Intern Profile: Christoph Demers
By
NPP Intern
Posted:
|
Transparency & Data

A look back at a busy few months from Christoph Demers, NPP's summer research intern.
5 Reasons to Talk to Congress This August
By
Robin Claremont
Posted:
|
Budget Process,
Military & Security,
Taxes & Revenue
August recess is the best opportunity to tell Congress your thoughts on Iraq, immigration, corporate taxes, unemployment benefits, and more.
$1.5 Trillion and Counting: What New Involvement in Iraq Means for Federal Spending
By
Lindsay Koshgarian
,
Jasmine Tucker
Posted:
|
Military & Security

As President Obama allowed a trickle of troops back into Iraq, and air strikes are expected to continue for weeks or months, Americans are wary about our role in a conflict most of us think we never should have started in the first place. Polls show that while Americans are divided on new airstrikes in Iraq, most are against sending troops back.
Pick Your Better Border Budget Battle: Can we reach a deal on the border crisis?
By
Lindsay Koshgarian
Posted:
|
Budget Process,
Military & Security

Competing funding proposals to deal with the border crisis express vastly different priorities about border security, refugee assistance, and legal representation, echoing the deep divisions about immigration reform overall.