Data Story: Unemployment and Underemployment
By
Becky Sweger
Posted:
|
Transparency & Data
To accompany this week’s look at employment numbers, we’ve updated last year’s unemployment and underemployment story from NPP’s Federal Priorities Database.
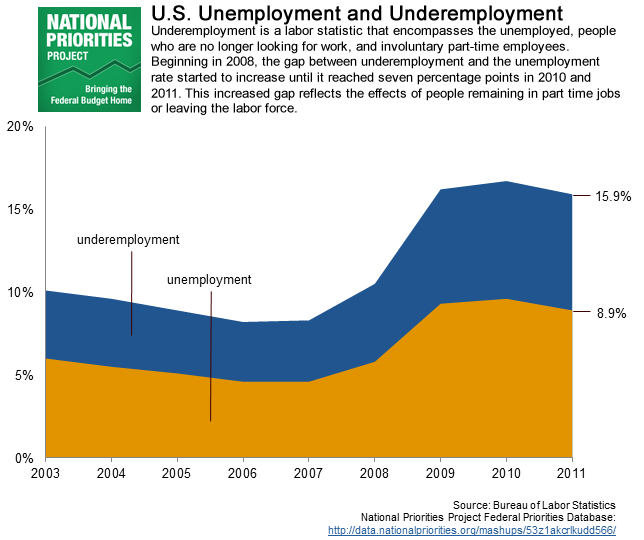
The chart below compares unemployment rates to underemployment rates. Underemployment is a number that not only counts the unemployed but also counts people no longer looking for work and part time employees who would rather be working full time. What’s interesting is that until the economic downturn, underemployment was about four percentage points higher than unemployment.
Since 2008, however, the gap between these numbers has increased, remaining at about seven percentage points at the end of 2011. This widening gap between unemployment and underemployment rates shows that more people are staying in part time jobs or leaving the labor force altogether.
To see these numbers for your state, visit the Federal Priorities Database. For more information about measuring the labor force, check out this week’s Budget Brief.